Alcatraz Pro Adds MTR Diagnostics
Alcatraz Pro is inext's cloud-based device-management platform — operators use it to monitor, update, and remotely control their set-top box fleet. We've added a new command to its console: mtr (My Traceroute). Operators can now run a network trace straight from a subscriber's set-top box to any destination — and see, hop by hop, exactly where a connection is breaking down.
Availability: the
mtrcommand requires firmware 1.17.17+ on TV5 series devices and 1.8.26+ on TV6 series devices.
What is MTR?
MTR (My Traceroute) is a network diagnostic tool that combines the functionality of the two classic utilities — ping and traceroute — into a single, unified view of the whole network path.
Instead of mapping the route just once (like traceroute) or testing only the final destination (like ping), MTR repeatedly probes the network path. It sends packets with incrementally increasing Time-To-Live (TTL) values to identify every router (hop) between the device and the destination host, reading the ICMP "time exceeded" reply that each hop returns.
Crucially, MTR doesn't probe each hop only once. It sends many cycles of packets and aggregates the replies into per-hop statistics — and that repetition is what makes the numbers trustworthy. A single traceroute can easily miss intermittent loss; MTR's accumulated sample reveals it.
How it works in the Alcatraz Pro console
Because the test runs on a remote set-top box rather than on a local terminal, Alcatraz Pro uses MTR in a run-and-report model — not a live stream:
- Configure the run. In the console the operator sets the destination and the test parameters — for example the number of cycles to run, the interval between probes (
-i), the protocol (ICMP by default, or TCP via-T), the target port (-P), the maximum number of hops (-m), and the packet size (-s). - The STB runs it. The set-top box executes
mtrfor the requested number of cycles, accumulating the per-hop statistics locally. - Results are delivered. When the run completes, the STB sends the finished report to the backend.
- The console displays it. Alcatraz Pro renders the hop-by-hop table — loss, latency, and jitter for every router along the path.
There's no live, tick-by-tick view; instead the console delivers a complete report for the controlled test that was configured — ready to read, save, and compare.
The metrics it provides
For every hop along the route, MTR reports:
- Packet Loss (%) — shows exactly which hop is dropping packets, so a failing router or bad link is immediately obvious.
- Latency (ping) — the current (
Last),Avg,Best, andWorstround-trip times for each hop, showing where delay is introduced. - Jitter (
StDev) — the variance in latency, which helps identify unstable or congested connections that hurt streaming quality.
A typical report looks like this:
                               Packets               Pings
 Host                        Loss%   Snt   Last   Avg  Best  Wrst StDev
 1. gateway.local             0.0%    50    0.4   0.5   0.3   1.2   0.1
 2. isp-core-1                0.0%    50    8.1   8.4   7.9  12.0   0.6
 3. transit-edge              2.0%    50   14.2  14.8  13.9  41.0   3.1
 4. peering-exchange          0.0%    50   15.0  15.3  14.8  18.2   0.5
 5. streaming-server          0.0%    50   15.4  15.6  15.1  19.0   0.4
How to read the output
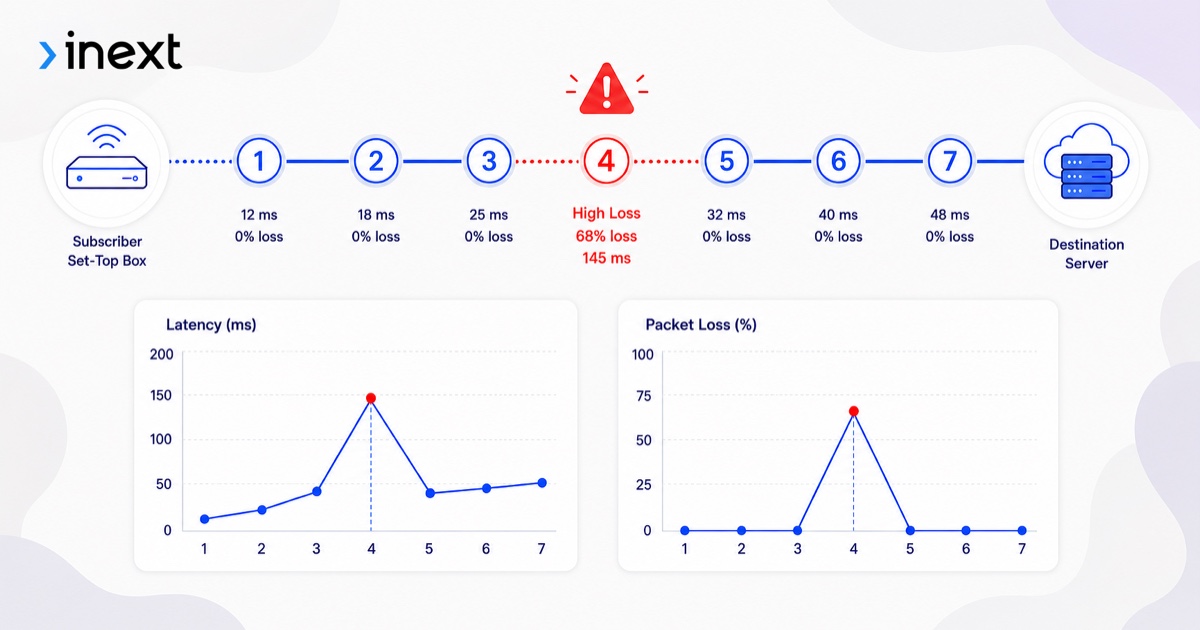
The single most useful rule when reading an MTR report: loss only matters if it carries through to the final hop.
In the example above, hop 3 shows 2% loss — but the destination (hop 5) shows 0%. That almost always means the router at hop 3 is rate-limiting or deprioritizing the diagnostic ICMP packets it has to generate itself, while still forwarding real traffic perfectly. It is not a problem for the operator's subscribers.
A genuine fault looks different: the loss appears at a hop and persists on every hop after it, all the way to the destination. That pattern points to the real failing link. (If a router blocks ICMP entirely, MTR can also probe over UDP or TCP to trace the path and test a specific port.)
Why this matters for operators
Network complaints are hard to diagnose because the problem usually isn't on the device or the server — it's somewhere in the path between them. With mtr in the Alcatraz Pro console, operators can:
- Run a trace from the subscriber's actual STB to their streaming or middleware servers, reproducing the subscriber's real network conditions.
- Localize the fault to a specific hop instead of guessing, turning "the stream keeps buffering" into "the loss starts at the transit provider's edge."
- Distinguish real packet loss from harmless ICMP rate-limiting, avoiding false alarms.
- Catch jitter and latency spikes that degrade live TV and VOD before they become support tickets.
Available via API
The mtr command is also exposed through the Alcatraz Pro API, so operators can automate diagnostics — for example, triggering a trace from a batch of STBs during an incident, or wiring path-quality checks into their own monitoring and alerting.
Further reading
- mtr — official project and source code (GitHub) — the open-source tool behind the command.
- mtr manual page — the full list of flags — reference for
-i,-T,-P,-m,-s, and more. - Cloudflare: What is MTR? — a concise primer on how MTR works.
- APNIC: How to properly interpret a traceroute or MTR — a deeper guide to reading the output.